Google considers Core Web Vitals to be a set of particular elements that contribute to a webpage’s overall user experience. Three specific page performance and user interaction statistics make up Core Web Vitals: Largest Contentful Paint (LCP), First Input Delay (FID), and Cumulative Layout Shift (CLS).
There are many more indicators in addition to the Core Web Vitals; therefore, they don’t work in isolation. Some measurements are based on controlled lab studies, while others are based only on field data. Google came up with a new set of metrics called Web Vitals after conducting extensive research.
These are a mix of measures we’re already familiar with, as well as a few new ones. The three Core Web Vitals are the most significant, and Google particularly requests that site owners monitor and improve these scores where possible.
Core Web Vitals Metrics
Here are the top three Core Web Vitals metrics:
Recommended for you: How to Amplify Your SEO with Video Content?
1. Largest Contentful Paint (LCP)
The Largest Contentful Paint (LCP) is a significant, user-centric statistic for measuring perceived load speed since it indicates when the website’s primary content has likely loaded – a quick LCP helps reassure the user that the page is helpful.
What constitutes a satisfactory LCP score?
Sites should aim for a Largest Contentful Paint of 2.5 seconds or less to ensure a decent user experience. The 75th percentile of page loads, divided across mobile and desktop devices, is an excellent benchmark to measure to ensure you’re hitting this target for the majority of your consumers.
How to optimize LCP?
You can optimize the LCP. Here are the best ways to optimize it:
- Choose the image with the right size and dimensions specific to desktop or mobile. This will help you avoid overloading.
- Use an image CDN to load the images faster.
- Avoid JavaScript to load images as it slows down the process.
- Use the right file format. For example, use JPG for images that have multi colors, PNG for line-art, or images with fewer colors.
- Use images that are responsive. Upload different image sizes based on the device.
- Avoid using a slider image. It is better to use a static image as it is made by HTML that makes it lighter and faster to load that image.
- Find a reputed hosting service that does not impact your loading time.
2. First Input Delay (FID)
This metric measures interactivity. Pages with an FID of 100 milliseconds or fewer should give a satisfactory user experience. The First Input Delay (FID) is a crucial user-centric statistic for determining load responsiveness since it measures the experience users have when attempting to engage with unresponsive pages—a low FID indicates that the page is usable.
What does a solid FID score look like?
Sites should aim for a First Input Delay of 100 milliseconds or less to give a decent user experience. The 75th percentile of page loads, divided across mobile and desktop devices, is an excellent benchmark to measure to ensure you’re hitting this target for the majority of your consumers.
How to optimize FID?
- Break long tasks into asynchronous tasks to allow user input to be processed between them.
- Minimize generating data and content on the client-side.
- Check the on-demand loading of third-party code, such as tags and analytics.
- Avoid running unused polyfills to reduce the amount of JavaScript on your page and the time browsers spend executing JavaScript.
- Use a web worker to run JavaScript on a background thread and reduce the workload on the main thread.
- Debounce scroll handlers and use input handlers to avoid any style changes.
3. Cumulative Layout Shift (CLS)
This measures visual stability. Pages with a CLS of 0.1 or less should deliver an excellent user experience. The Cumulative Layout Shift (CLS) is an important user-centric metric for gauging visual stability since it quantifies how often users experience unexpected layout shifts—a low CLS indicates that the page is enjoyable.
What does a solid CLS score look like?
Sites should aim for a CLS score of 0.1 or less to ensure a decent user experience. The 75th percentile of page loads, divided across mobile and desktop devices, is an excellent benchmark to measure to ensure you’re hitting this target for the majority of your consumers.
How to optimize CLS?
- Include size attributes on your images and video content.
- Use CSS aspect ratio boxes to allow browsers to allocate the right amount of space while the image or video is loading.
- Avoid adding content above existing content to ensure layout shifts.
- Use animations of properties instead of transform animations.
- Preload your custom web fonts to avoid any page speed performance issues. It helps font assets to have a higher priority in page rendering.
- Use aggregate caching and CDN to host static assets.
- Use iFrame, Inline HTML code, and JavaScript tag with HTML fallback to display web content from other platforms on your pages, such as YouTube videos or Instagram posts.
- Insert dynamic content below existing content to avoid layout shifts.
- Reserve space for dynamic content in the case when you can avoid inserting dynamic content above existing content.
Top Tools to Measure Core Web Vitals

The following are the 3 tools you’ll need to run the Core Web Vitals test:
The primary goal of these tools is to assess performance throughout the development cycle. As a result, before deploying the application to production, you can set standards and check compliance.
Furthermore, you may replicate user behavior on your website and provide debugging results that are repeatable.
These Core Web Vitals tools can be used to calculate Total Blocking Time (TBT), which is the total amount of time a website was blocked, prohibiting user engagement.
Here are the top tools for measuring Core Web Vitals:
You may like: 16 Best Free Website Analysis / Analytics Tools to Supercharge your SEO.
1. Page Speed Insights
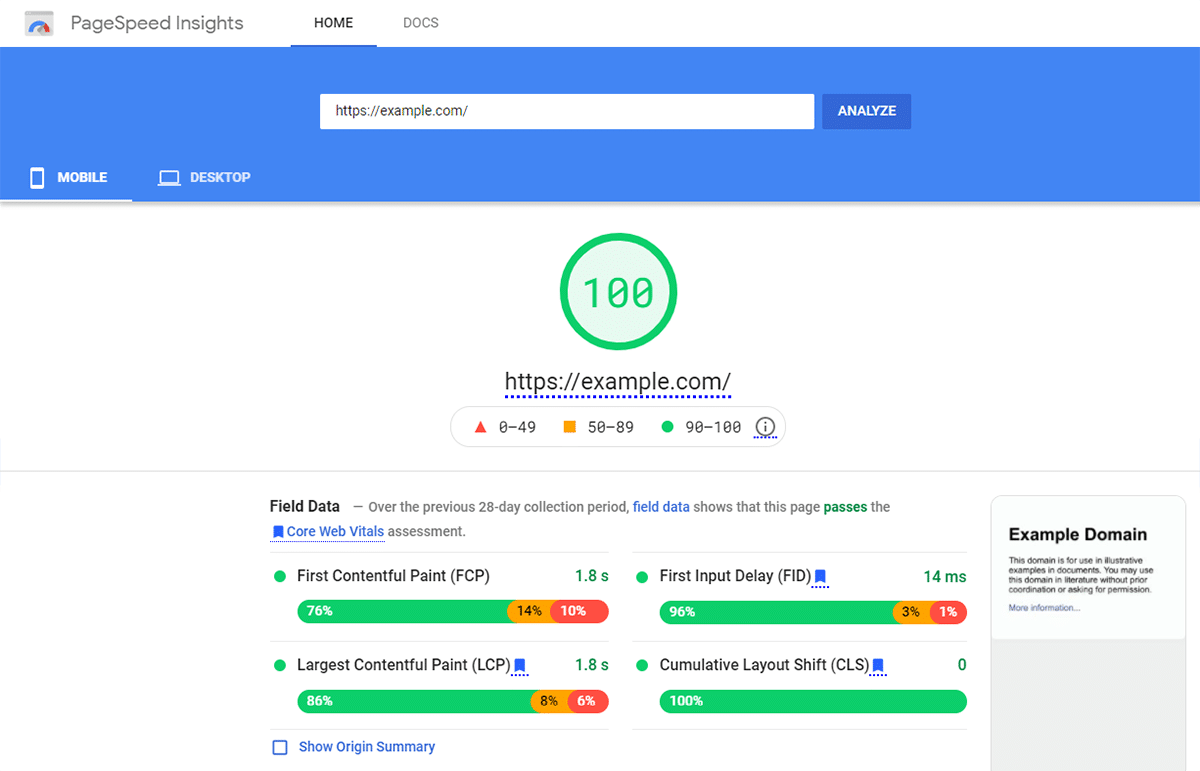
Undoubtedly, Page Speed Insights is a powerful tool for webmasters, developers, and site owners of all kinds.
However, we’ve seen that many people concentrate on optimizing their websites to get a perfect score on this test.
If you aren’t familiar with page speed insights, it’s a tool for evaluating the performance of websites. You can evaluate any URL. Once you enter the URL, Google will provide the overall score for 100 for the URL you’ve evaluated.
Google would also provide how to improve the performance of the URL based on several performance enhancements.
Lighthouse, Google’s open-source, automated technology for improving the overall quality of web pages, is used to calculate Page Speed Insights scores. Performance, accessibility, progressive web apps, and other criteria can all be assessed using this platform and will see about a lighthouse in detail.
Recommendations from Google Page Speed Insights:
- Render-Blocking Resources Should Be Removed.
- Important Requests Shouldn’t Be Chained.
- Reduce the number of requests and the size of transfers.
- Marks and Measures for User Timing.
- Reduce Third-Party Code’s Impact.
- With an Efficient Cache Policy, You Can Serve Static Assets.
- Preload Key Requests.
2. Finteza Lighthouse Report
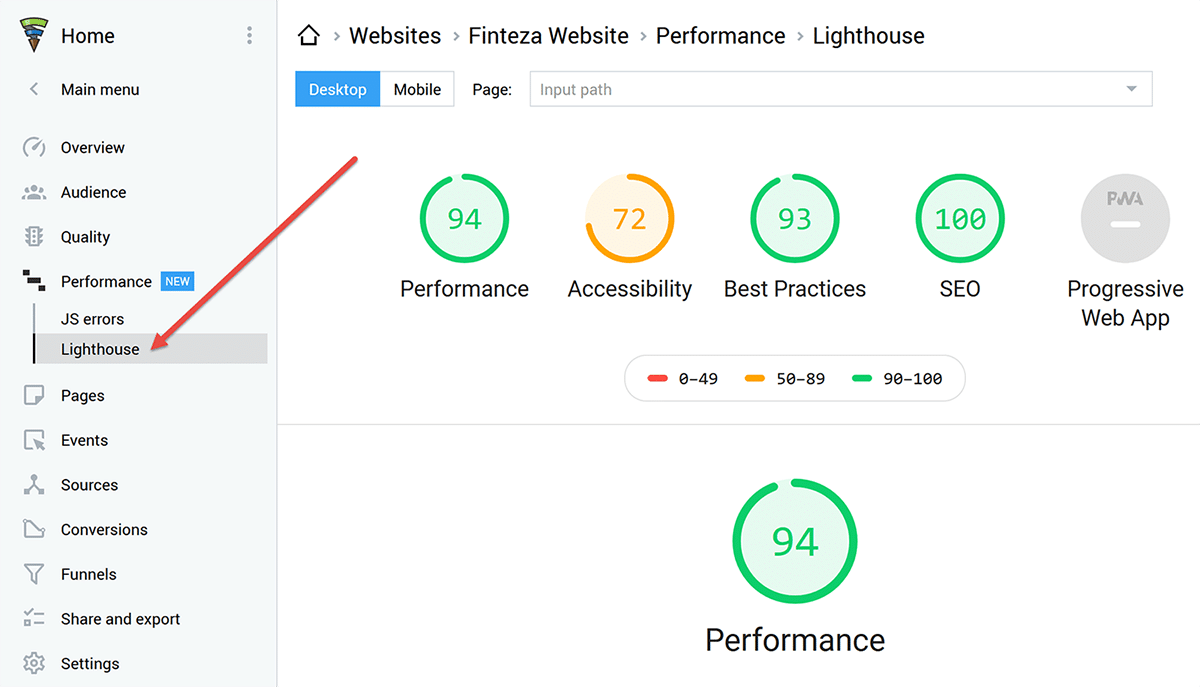
The Finteza lighthouse report is used for basic general audit for the website.
The report assists in making the site faster, minimizing vulnerabilities, and aligning web pages with Google suggestions, ultimately enhancing the search engine ranking of your project.
In addition, you’ll be able to assess your online project in various ways and receive advice on addressing any issues that arise. You can generate the report for desktop as well as mobile versions.
Parameters for evaluating the Lighthouse website are as follows:
- Performance where the software compares the loading speed of your site to that of other websites.
- Accessibility where the tool measures user experience like how user-friendly the website is.
- SEO or search engine optimization offers tips to assist you in increasing your site’s search engine rankings. The report is based on the findings of 15 inspections, the majority of which are fundamental indications such as canonical, title, and Meta tags.
- Best practices provide tips for optimizing your website using Google’s “best practices.” For example, the report examines browser problems in the console, aspect ratio, picture resolution; fonts; and HTTPS use — a total of 15 criteria.
3. Google Search Console
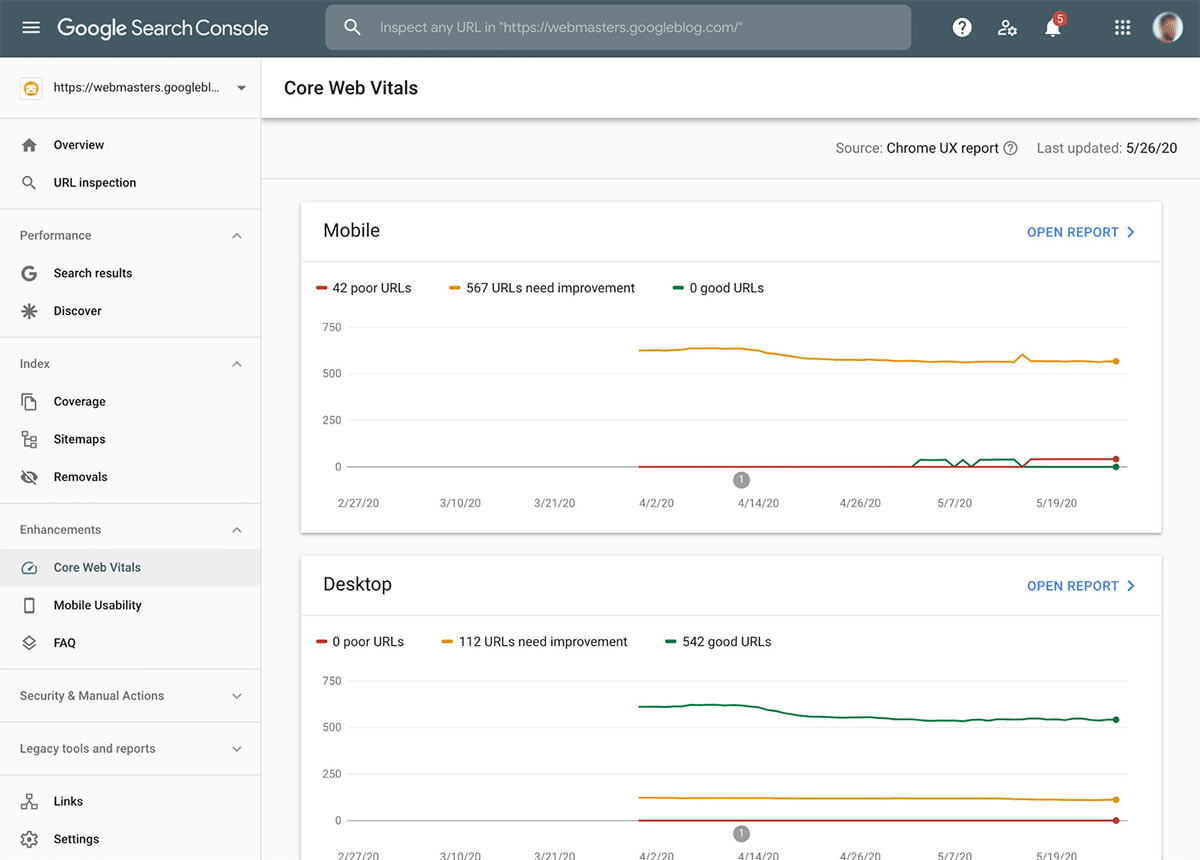
Google recently announced planned updates to Search Console, including the addition of Core Web Vitals as new metrics that widen Google’s approach to measuring website speed and performance.
The search console consists of new core vital reports. It examines websites using CrUX’s real-world data and identifies those that need to be improved.
The URL’s performance is divided into three categories: status, metric kind, and URL group. It explains the core metrics largest contentful paint, First Input Delay, and cumulative layout shift.
After analyzing metrics, you can optimize your URL performance using lighthouse and page speed insight.
You may also like: 10 Best Free SEO Tools.
Final Thoughts

Core Web Vitals is now live. Hence, webmasters need to take immediate actions to optimize their site for the Core Web Vitals to minimize any negative effects. The best way to make your site Core Web Vital friendly is to increase your site speed and make it mobile-friendly. Also, SEO should not be ignored since it helps to improve the overall user experience.


