In the contemporary and swiftly evolving business environment, a meticulous examination of companies is vital for investors and industry aficionados.
This article presents an exhaustive comparative analysis of Apple (NASDAQ: AAPL) alongside its principal competitors within the Technology Hardware, Storage & Peripherals sector.
By scrutinizing essential financial indicators, market position, and growth potential, we aspire to furnish investors with significant insights while illuminating the company’s performance in its sector.
Apple Overview
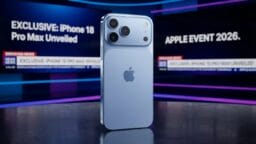
Apple, recognized as one of the preeminent corporations globally, boasts a diversified portfolio encompassing hardware and software solutions tailored for both consumers and enterprises.
The iPhone remains the cornerstone of the company’s revenue, with supplementary products like the Mac, iPad, and Watch intricately linked to a broad software ecosystem centering around the iPhone.
Over time, Apple has diligently expanded its offerings to include new applications such as streaming services, subscription bundles, and augmented reality.
The enterprise designs its proprietary software and semiconductors while collaborating with third-party manufacturers, including Foxconn and TSMC, for product assembly.
Approximately half of Apple’s revenue is generated directly from its renowned retail locations, with the remainder derived through strategic partnerships and distribution channels.
| Company | P/E | P/B | P/S | ROE | EBITDA (in billions) | Gross Profit (in billions) | Revenue Growth |
|---|---|---|---|---|---|---|---|
| Apple Inc | 38.55 | 45.62 | 10.64 | 27.84% | $39.02 | $54.77 | 16.36% |
| SanDisk Corp | 24.29 | 16.67 | 13.72 | 46.78% | $7.89 | $7.58 | 371.59% |
| Seagate Technology Holdings PLC | 61.78 | 90.12 | 16.13 | 79.34% | $1.64 | $1.9 | 48.49% |
| Western Digital Corp | 16.40 | 17.95 | 13.08 | 34.3% | $3.36 | $2.03 | 43.84% |
| Hewlett Packard Enterprise Co | 31.32 | 3.04 | 2.05 | 5.83% | $2.33 | $4.9 | 33.68% |
| NetApp Inc | 27.94 | 25.99 | 5.36 | 26.35% | $0.55 | $1.42 | 29.89% |
| Everpure Inc | 142.66 | 22.52 | 8.47 | 4.97% | $0.11 | $0.81 | 37.73% |
| Super Micro Computer Inc | 11.99 | 2.50 | 0.70 | 12.83% | $1.57 | $1.94 | 93.16% |
| Logitech International SA | 18.55 | 6.16 | 3.03 | 10.33% | $0.28 | $0.61 | 6.93% |
| Diebold Nixdorf Inc | 20.93 | 2.21 | 0.59 | 1.56% | $0.09 | $0.24 | 1.7% |
| Corsair Gaming Inc | 43.16 | 2.18 | 0.99 | 1.04% | $0.02 | $0.1 | -1.8% |
| Immersion Corp | 21.21 | 0.80 | 0.14 | 1.93% | $0.01 | $0.06 | 0.81% |
| Average | 38.2 | 17.29 | 5.84 | 20.48% | $1.62 | $1.96 | 60.55% |
A meticulous analysis of Apple yields several notable observations:
- The current Price-to-Earnings ratio stands at 38.55, exceeding the industry average by 1.01x, which suggests a heightened valuation compared to peer companies.
- The Price-to-Book ratio at 45.62 is 2.64x higher than industry norms, indicating that Apple may be perceived as overvalued relative to its book value.
- The company’s Price-to-Sales ratio of 10.64 is 1.82x greater than the industry mean, further implying potential overvaluation based on sales outputs.
- Apple’s Return on Equity (ROE) of 27.84% surpasses the industry average by 7.36%, reflecting effective equity utilization to yield profits.
- The organization showcases a substantial EBITDA of $39.02 billion, which is 24.09x greater than the industry average, signifying robust profitability and vigorous cash flow capabilities.
- With a gross profit of $54.77 Billion, Apple’s performance is 27.94x higher than its sector competitors, demonstrating impressive profitability from its core activities.
- Conversely, a revenue growth rate of 16.36% falls significantly short of the industry average of 60.55%, suggesting challenges in expanding sales volume.
Debt-to-Equity Ratio
The debt-to-equity (D/E) ratio elucidates the balance of debt and equity utilized by a company for financing its assets and operations.
Examining the debt-to-equity ratio across the industry facilitates a precise assessment of a company’s fiscal stability and risk profile, which proves invaluable for informed decision-making.
In comparing Apple’s D/E ratio with its four principal competitors, the following insights emerge:
- With respect to the debt-to-equity ratio, Apple presents a more favorable financial standing vis-à-vis its top four rivals.
- This positioning indicates a balanced approach to debt and equity, exemplified by a lower D/E ratio of 0.78, a characteristic that investors typically view positively.
Key Insights

Apple’s elevated P/E, P/B, and P/S ratios relative to competitors in the Technology Hardware, Storage & Peripherals sector suggest that the stock may be overvalued.
However, the company’s superior ROE, EBITDA, and gross profit margins—alongside stagnant revenue growth—underscore its operational efficiency and profitability when juxtaposed with industry peers.
Source link: Benzinga.com.