Since the COVID-19 crisis, there has been a sharp increase in the number of online events. But just like offline events, it’s not enough to just host these events. You also need to put in the hard work to promote your virtual event and create buzz around it.
While you are at it, it’s also important to keep an eye on key metrics to assess whether or not your marketing efforts are paying off. If you’re lagging behind, you can change your strategy to make the event more successful.
That brings us to the question — which key metrics should you track? In this post, we’ve listed the most important metrics for you.
6 Key Metrics That You Should Track for Online Events

Some of these metrics are pretty obvious, the others so not much. Here is the list of metrics that are important to gauge the success of virtual events.
Recommended for you: 7 Fantastic iPad Solutions & Apps for Use in Events.
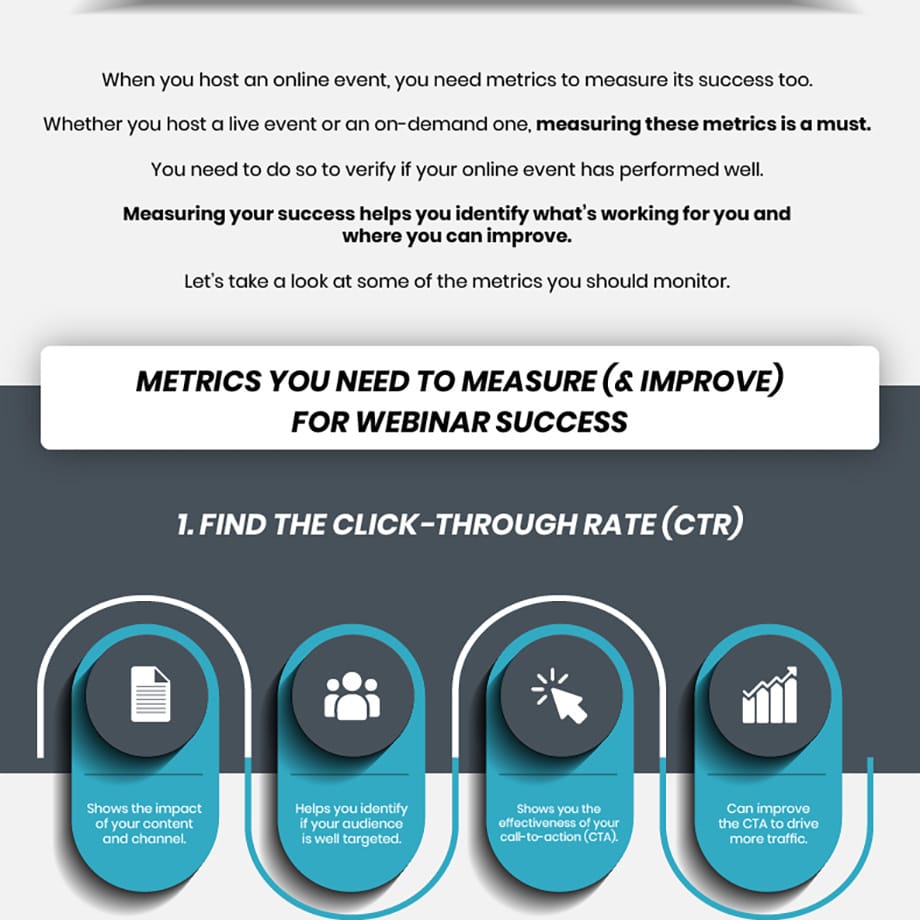
1. Click-Through Rate (CTR)
To promote your event, you’ve likely created a social media or online ad. Whatever it is, take a look at the click-through rate (wiki).
People who are clicking on your copy are most likely to be interested in your event. A higher CTR indicates that your copy, as well as promotional efforts, are effective.
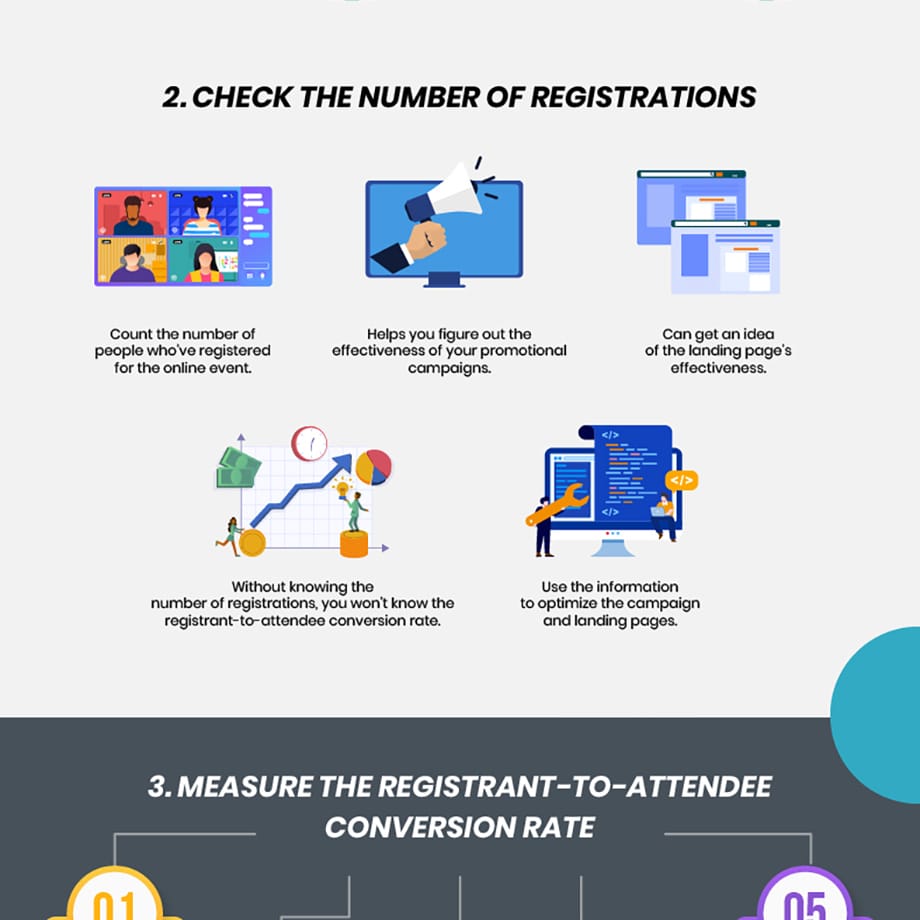
2. Total Number of Registrations
If someone is making the effort to register for your event, it is a clear indication that they are interested in your event. If registration requires a fee and they are willing to pay, that means they are genuinely looking forward to the event.
The higher the number of registrations, the more successful your event is likely to be. It also indicates that your landing page copy is effective.
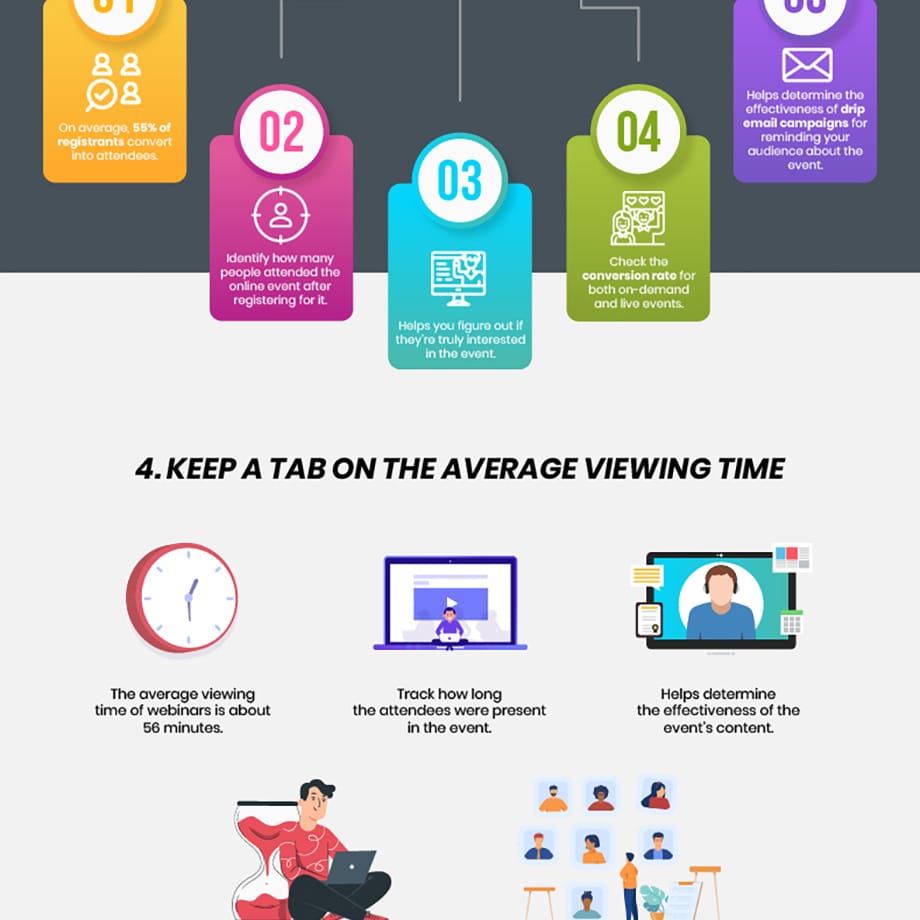
3. Registrant-to-Attendee Conversion Rate
Don’t expect everyone who registered for your event to turn up. Some people may be caught up in a family emergency or other plans might have come up. There can be many different reasons why someone who registered doesn’t actually attend your virtual event.
While looking at the number of registrations can give you a fair idea of those interested, it only gives you half the picture. The total number of attendees who actually showed up to the event gives you a better idea of the effectiveness of your marketing efforts.
Here is how you can calculate this metric:
Registrant-to-attendee ratio = [Number of event attendees/Number of event registrations] x 100
On average, a 55% registrant-to-attendee conversion rate is considered good. If yours is anywhere around it or higher, you should give yourself a pat on the back.
4. Average Viewing Time
Are people sitting through the entire duration of your virtual event? Or are they dropping off somewhere in between? Answering these questions can help you figure out how engaging your event was for the audience.
To get a better idea, take a look at the average viewing time for your event. The longer it is, the more likely it is that your audience found your event to be interesting.
Here is how to calculate the average viewing time:
Average Viewing Time = Total Viewing Time of All Attendees/Number of Attendees
But what’s a good score? Want a point of reference?
For webinars, the average viewing time is a little less than an hour. If your average time is anywhere between 50-60 minutes, you’re doing it right.
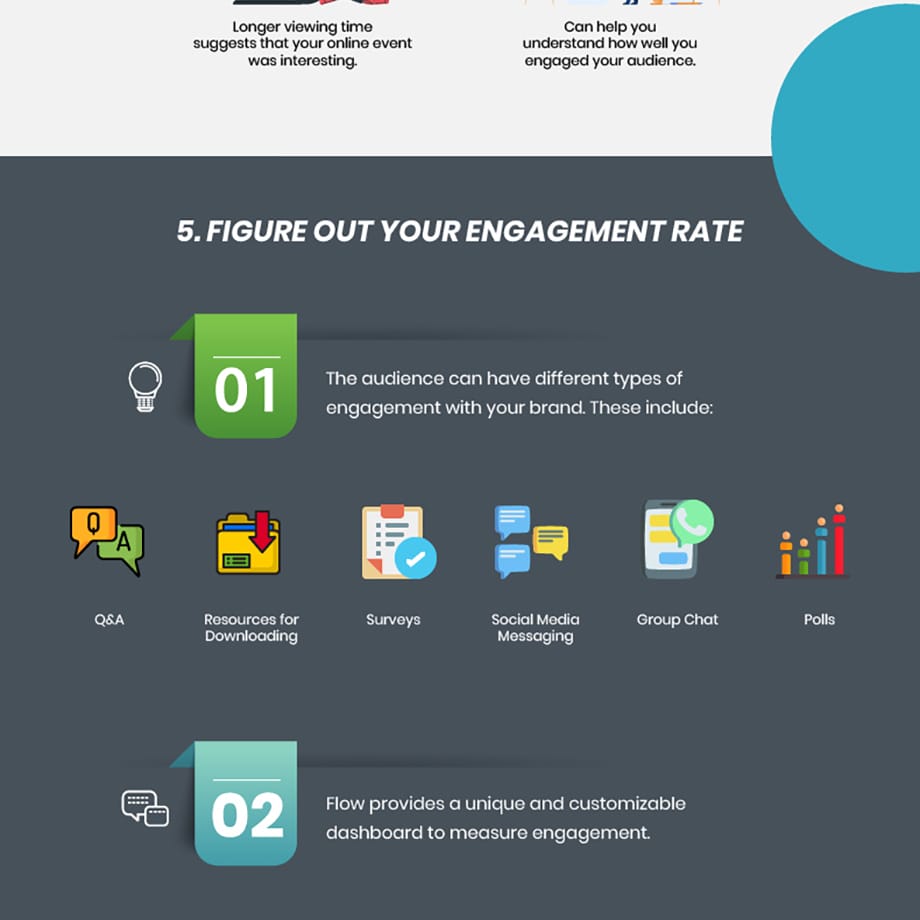
5. Engagement Rate
When you find a conversation engrossing, you’re likely to engage in the conversation, right? If you get a lot of comments, shares, or even likes for your virtual event, you’ve got an engaged audience.
It’s like a seal of proof. Of course, the higher your engagement rate is, the more conversation you could spark from the event.
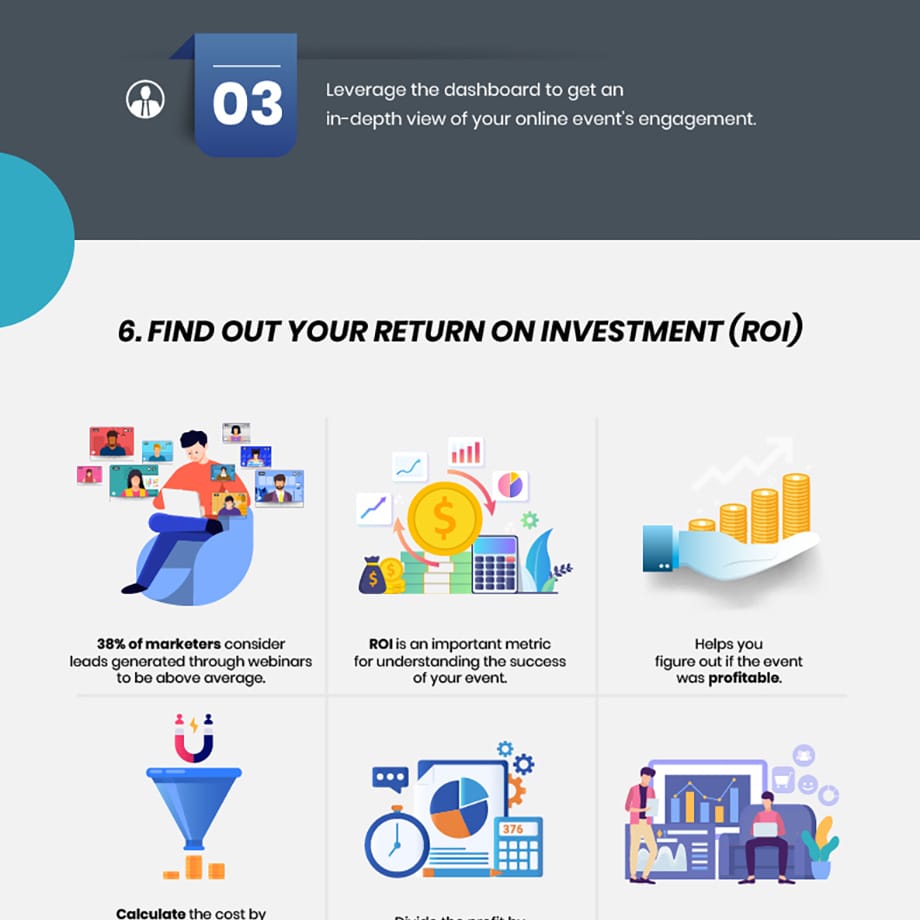
6. Return on Investment (ROI)
Hosting an event requires investment. You may have to pay for your speakers and even invest in special equipment for the show. Add all of your costs together and compare the total to the total revenue you’ve made.
Here’s the formula to calculate your event ROI:
Event ROI = [Cost of the event/Revenue generated] x 100
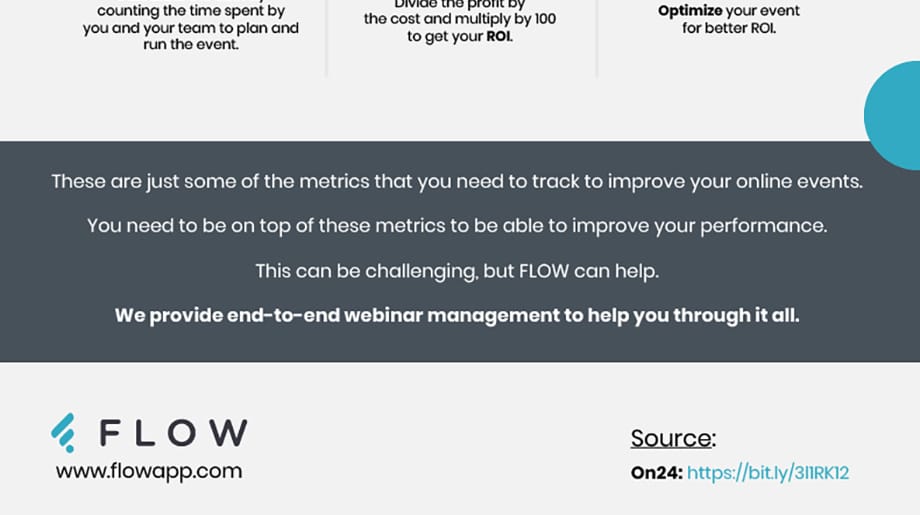
All of these metrics can help you assess the effectiveness of your overall marketing strategy and the event itself.
You may also like: How to Create a Family Event Website Using WordPress?
6 Key Metrics for Breakthrough Online Events (Infographic)
To learn more about these metrics, check out the infographic below first published by FLOW:
This infographic is shared by Belal Atiyyah, the CEO, Omnovia Technologies Inc. Belal has had a 30-year international business career spanning energy and technology. He has a BEng in Electronic Systems and a Masters in Business. His passion is strategic problem solving through technology.
 This infographic is shared by Belal Atiyyah, the CEO, Omnovia Technologies Inc. Belal has had a 30-year international business career spanning energy and technology. He has a BEng in Electronic Systems and a Masters in Business. His passion is strategic problem solving through technology.


