We are introducing Kendo UI chart using Kendo UI Java script in MVC based application. Chart is a graphical representation of a data, in which data is represented by symbols. There are many types of charts like bar chart, pie chart, line chart, Gauge chart.
Here we are introducing bar chart and gauge chart using Kendo UI JavaScript and CSS files. Below are the steps to make bar chart and gauge chart in MVC based application.
- Download Trial version of Kendo UI JavaScript and CSS, for download click here.
- For giving the Kendo UI reference of JavaScript and CSS we need to write below code in MVC view, give reference of Kendo UI JavaScript in MVC view and then call the Html Kendo chart() function where we need show the chart see as per below code.
<script src="~/ReportJS/kendo.all.min.js"></script>
<script src="~/ReportJS/console.js"></script>

<link href="~/css/reportstyle.css" rel="stylesheet" type="text/css" />
<link href="~/css/examples-offline.css" rel="stylesheet">
<link href="~/css/kendo.common.min.css" rel="stylesheet">
<link href="~/css/kendo.rtl.min.css" rel="stylesheet">
<link href="~/css/kendo.default.min.css" rel="stylesheet">
<link href="~/css/kendo.dataviz.min.css" rel="stylesheet">
<link href="~/css/kendo.dataviz.default.min.css" rel="stylesheet">
As per above code we can give the reference for Kendo.all.min.js and CSS from project location.
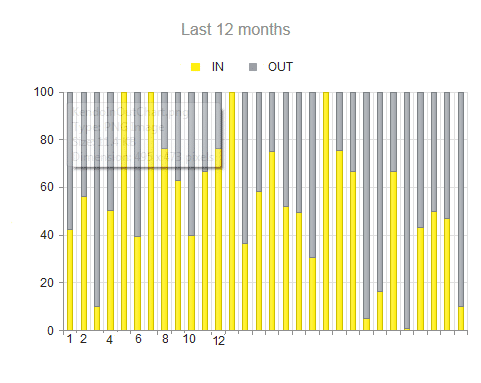
Now, for example we need bar chart and gauge chart for our Dashboard data represent, so for that we have use Html Kendo Chart function of Kendo UI JavaScript and give the required value parameter Like Legend Position, Series Column in which Give the name of column then if we have to give color then need to give it in parameter as per below screenshot, also need to provide axis value and label for that axis that we have to define as per given below code.
<div id="example3" class="example">
    <div class="demo-section k-content">
    <div id="chart"></div>
    @(Html.Kendo().Chart()
        .Name("chart2")
        .Title(@Resource.ChartTitle2)
        .Legend(legend => legend.Position(ChartLegendPosition.Top))
        .Series(series =>
        {
            series.Column(Model.InChart).Name("IN").Color("#ffed02").Stack(true);
            series.Column(Model.OutChart).Name("OUT").Color("#9ba0a").Stack(true);
        })
        .CategoryAxis(axis => axis.Categories(Model.ByServiceforChart2).Labels(x => x.Rotation(-90)))
        .ValueAxis(axis => axis.Numeric().Labels(labels => labels.Format("{0}"))
        .Title(@Resource.Missions)
        .Min(0).Max(100))
        .Tooltip(tooltip => tooltip.Visible(true).Format("{0}"))
    )
    </div>
</div>
Above code is for Bar chart that we need to write in div where we need that chart, here we also give the title for Bar chart, also for Gauge Chart we need to write code in java script function as per below Code.
<div id="gauge-container">
<div id="gauge_title1" class="gauge_title">@Resource.GaugeTitle</div>
<div id="gauge" class="gauge"></div>
<input type="hidden" id="gauge-value" value="@Model.IndexPercentageForGauge">
<div class="gauge-valuedisplay">@Model.IndexPercentageForGauge1</div>
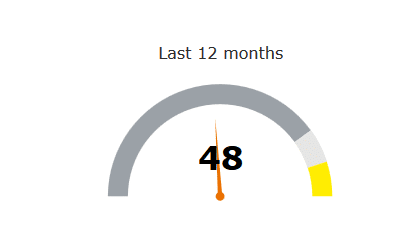
</div>Here we define the div for gauge chart and give the title for it and use the div Id for call the Kendo UI bind JavaScript function for call the gauge chart as per below code in document.ready function in JavaScript as per below screenshot and then call that function using Id value.
$(document).ready(function () {
    createGauge();
    $(document).bind("kendo:skinChange", function (e) {
        createGauge();
    });
});
Below is JavaScript call for createGauge() function using KendoRedialGauge for gauge Chart that we need to write in JavaScript as per below Code.
function createGauge() {
    $("#gauge").kendoRadialGauge({
        pointer: {
            value: $("#gauge-value").val()
        },
        scale: {
            minorUnit: 5,
            startAngle: 0,
            endAngle: 180,
            max: 100,
            rangeSize: 20,
            labels: [
                { visible: false, }
            ],
            minorTicks: { visible: false },
            majorTicks: { visible: false },
            ranges: [
                { from: 0, to: 80, color: "#9ba0a6" },
                { from: 80, to: 90, color: "#e6e6e4" },
                { from: 90, to: 100, color: "#ffed02" }
            ]
        }
    });
}
Now for above bar chart and gauge chart we need data model that we get by controller action method as per below action result method using controller.
/// <summary>
/// Used to show chart on screen
/// </summary>
/// <returns></returns>
public ActionResult Index(Guid? id = null, int? page = 1, int? ispageopen = 0) {
    List<Dashboard> dashboard = new List<Dashboard>();
    Dashboard reportdata = new Dashboard();
    DateTime FromDate = DateTime.Now.AddMonths(-12).Date;
    DateTime ToDate = DateTime.Now;
    try {
        reportdata = new Dashboard();
        reportdata.ByService = reports.GetByService("", FromDate, ToDate);
        if (reportdata.ByService !=null && reportdata.ByService.Count > 0) {
            int a = 0;
            Math.Round(reportdata.ByService.Where(x => x.Service == "ALL").FirstOrDefault().Ratio, 0).ToString().ToInt(ref a);
            reportdata.IndexPercentageForGauge1 = a;
            reportdata.OutChart2 = new double[reportdata.ByService.Count - 1];
            reportdata. InChart2 = new double[reportdata.ByService.Count - 1];
            reportdata.ByServiceforChart2 = new List<string>();
            for (int i = 0; i < reportdata.ByService.Count - 1; i++) {
                reportdata.OutChart2[i] = Math.Round(reportdata. ByService[i]. OutSla * 100.0 / reportdata. ByService[i].Overall,2);
                reportdata.InChart2[i] = Math.Round(reportdata.ByService[i].InSla * 100.0 / reportdata. ByService[i].TicketsOverall, 2);
                reportdata. ByServiceforChart2.Add(reportdata. ByService[i].Service);
            }
        } else {
            reportdata.IndexPercentageForGauge1 = 0;
        }
        FromDate = DateTime.Now.AddHours(-24).Date;
        ToDate = DateTime.Now;
        reportdata.ByService = reports.GetByService("", FromDate, ToDate);
        if (reportdata. ByService !=null && reportdata. ByService.Count > 0) {
            int a = 0;
            Math.Round(reportdata. ByService.Where(x => x.Service == "ALL").FirstOrDefault().Ratio, 0).ToString().ToInt(ref a);
            reportdata.IndexPercentageForGauge2 = a;
            reportdata.OutChart1 = new double[reportdata.ByService.Count - 1];
            reportdata.InChart1 = new double[reportdata. ByService.Count - 1];
            reportdata.ByServiceforChart1 = new List<string>();
            for (int i = 0; i < reportdata.ByService.Count - 1; i++) {
                reportdata.OutChart1[i] = Math.Round(reportdata. ByService[i]. OutSla * 100.0 / reportdata.ByService[i]. Overall,2);
                reportdata.InChart1[i] = Math.Round(reportdata.ByService[i].In * 100.0 / reportdata.ByService[i]. Overall,2);
                reportdata. ByServiceforChart1.Add(reportdata. ByService[i].Service);
            }
        } else {
            reportdata.IndexPercentageForGauge2 = 0;
        }
    } catch (Exception ex) {
        if (log.IsErrorEnabled)
            log.Error(ex.Message, ex);
    }
    return View(reportdata);
}
As per above controller method call we got the result data for bar chart and Gauge chart in dashboard model class so we can represent the data in gauge in percentage and bar chart in bars as per below.
Here we display the In Out data for last 12 month using Kendo UI bar chart in different color that we using above code we write in our MVC view and also for gauge chart we display Percentage ratio of data in different color as per below screenshots.
Result of the Kendo UI Chart:
1. Bar Chart:-
2. Gauge Chart:-
Advantages of Kendo UI Charts:
Ultimate performance gives to UI with minimum resources and easy to use in MVC based application.
This article is written by Ethan Millar. He is intense about coding and everything related to ASP.Net. , He has been involved in a wide range of projects and best practices to develop high quality software that meets project requirements, budget, and schedule. You can hire him as a asp.net programmers. You can follow him in Google+.